X-ray, CT, MR and mammography.
We evaluate what your group needs and identify the right algorithm for each modality and use case. The result comes back in the form that fits it: an image, a report or a worklist priority.
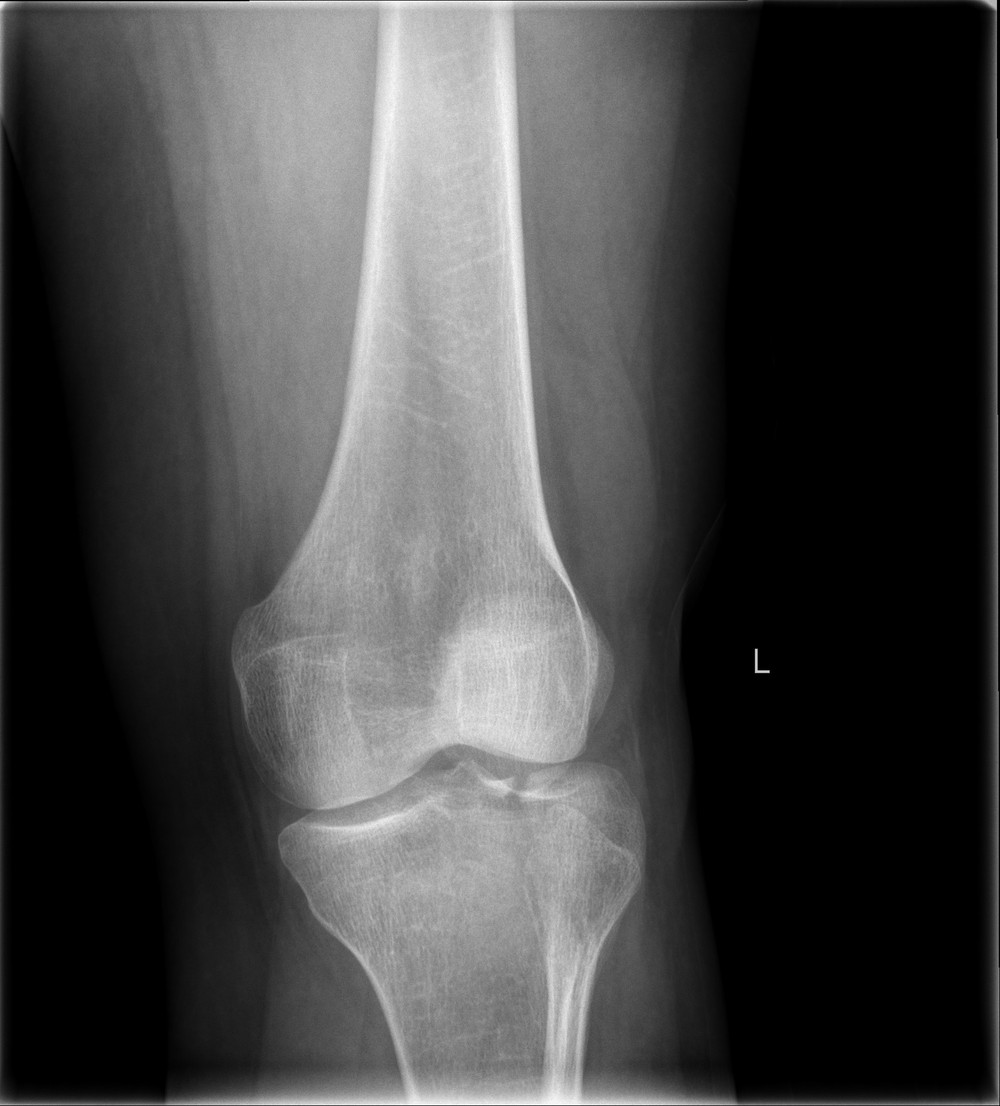 FRAC.EXAMPLE · X-RAY · AI MARKING ILLUSTRATIVEFOR REVIEW
Image: LottieLattes, Lateral Tibial Plateau fracture XRay with Depression, CC BY-SA 4.0, via Wikimedia Commons. Resized; the marking is an illustrative overlay.

Detection on bone studies
The AI marks regions that may contain a fracture, effusion or dislocation. The marked image returns to the study for the radiologist to review.
- Boxes with short labels
- Original image stays untouched
- Radiologist confirms or dismisses
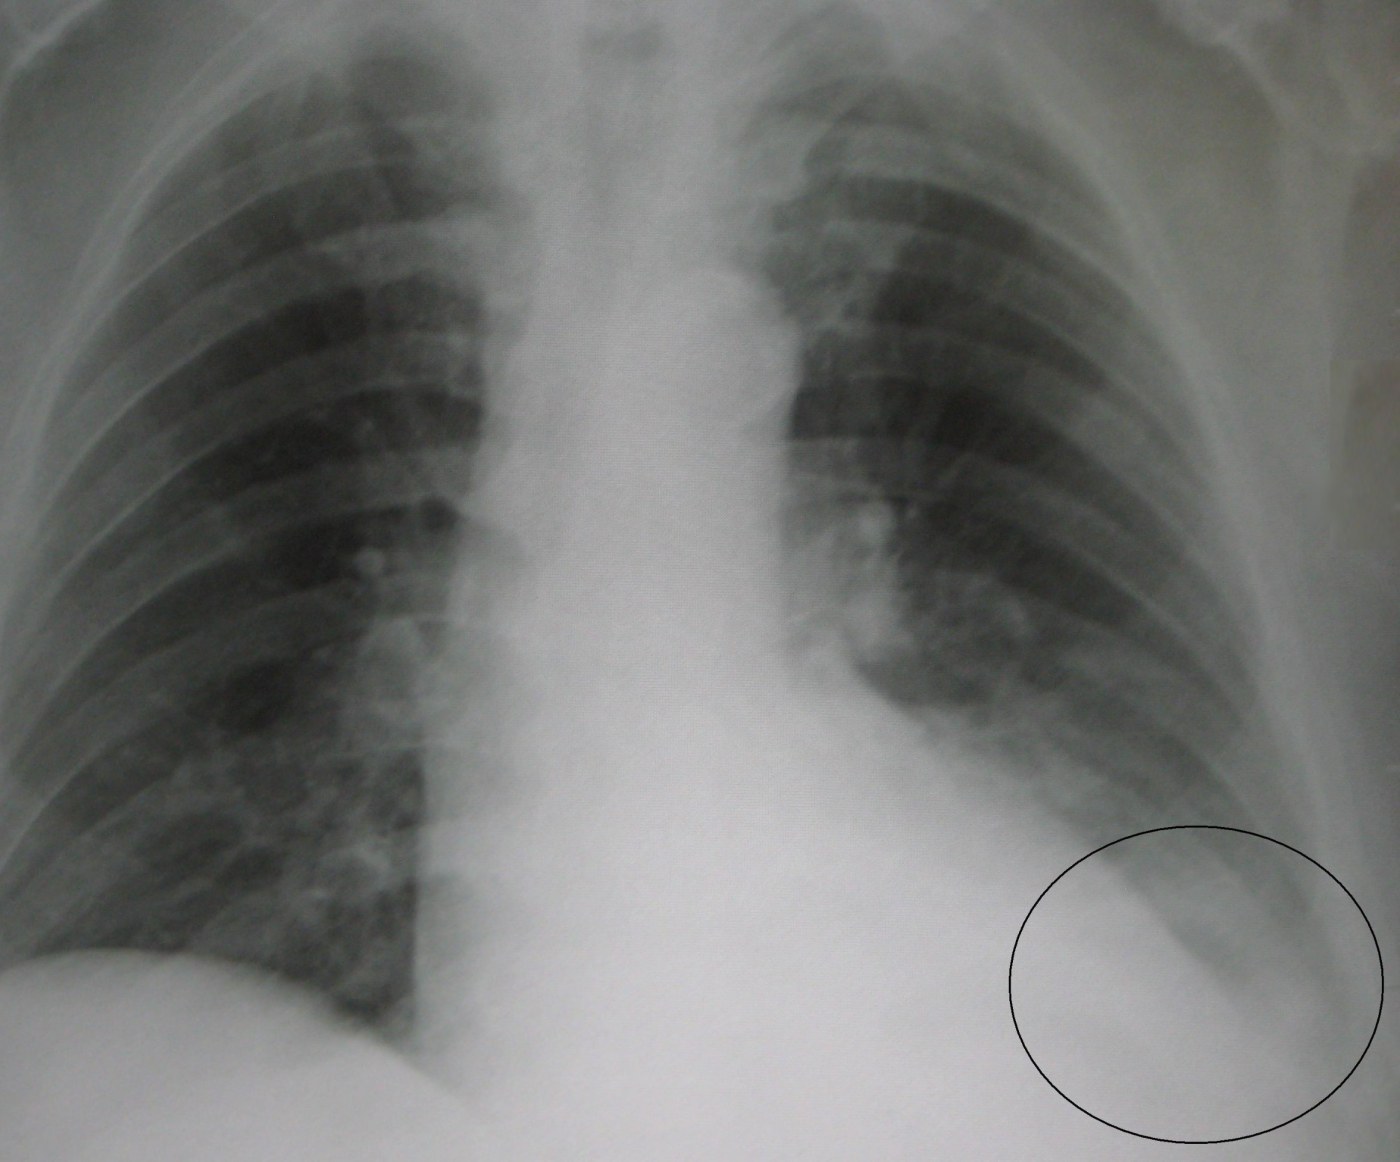 CONSOLID.EXAMPLE · CHEST X-RAY · AI MARKING ILLUSTRATIVEFOR REVIEW
Image: James Heilman, MD, LLL pneumonia with effusion, CC BY 3.0, via Wikimedia Commons. Cropped and resized; on-screen text at the edges removed. The ring is part of the original photo; the label is an illustrative overlay.

Detection on chest studies
Findings such as consolidation, effusion, nodules or pneumothorax can be flagged on the image, with a summary at study level.
- Region boxes by finding
- Study-level summary
- Triage of urgent studies
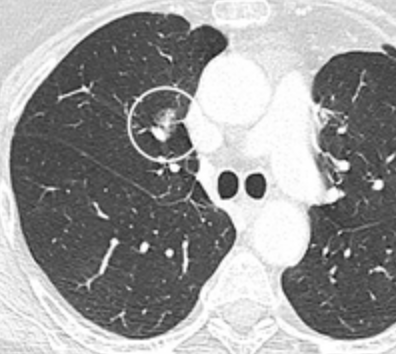 NODULEEXAMPLE · CT · LUNG WINDOWFOR REVIEW
Image: Snoeckx et al., CT of part solid lung nodule, CC BY 4.0 via Wikimedia Commons. Label added; the ring is part of the original figure.

Nodule detection on CT
The AI marks candidate nodules on the slice and can report size and location, so the radiologist can jump straight to them.
- Marker on the slice
- Size and location in the result
- Comparison with prior studies where supported
 HIPKNEEANKLEEXAMPLE · LEG LENGTH MEASUREMENTFOR REVIEW
Radiograph: public domain (CC0 1.0), via Wikimedia Commons. Panels cropped and arranged side by side. Yellow lines are part of the original figure.
Automatic measurements
Landmarks, levels and lengths are marked on the image and listed in a table, replacing manual tracing. Common uses include leg length, alignment and angle measurements.
- Levels and landmarks on the image
- Values and differences in a table
- Consistent from study to study
| Right | Left | Difference | |
|---|---|---|---|
| Femur length | 527 mm | 527 mm | 0 mm |
| Tibia length | 405 mm | 403 mm | 2 mm |
| Full leg length | 931 mm | 929 mm | 2 mm |
MRI · LUMBAR SPINE · SAG T2
2 of 4 regions with findings
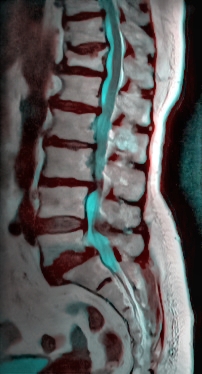
Image: © Nevit Dilmen, CC BY-SA 3.0, via Wikimedia Commons; shown unmodified. The report is an example written for this page and is not related to the image shown.
Structured MR reports
For MR the result is often a structured report: labeled levels, findings per level, and for follow-up studies a comparison with the prior exam.
- Labeled anatomy
- Findings per level or region
- Longitudinal comparison
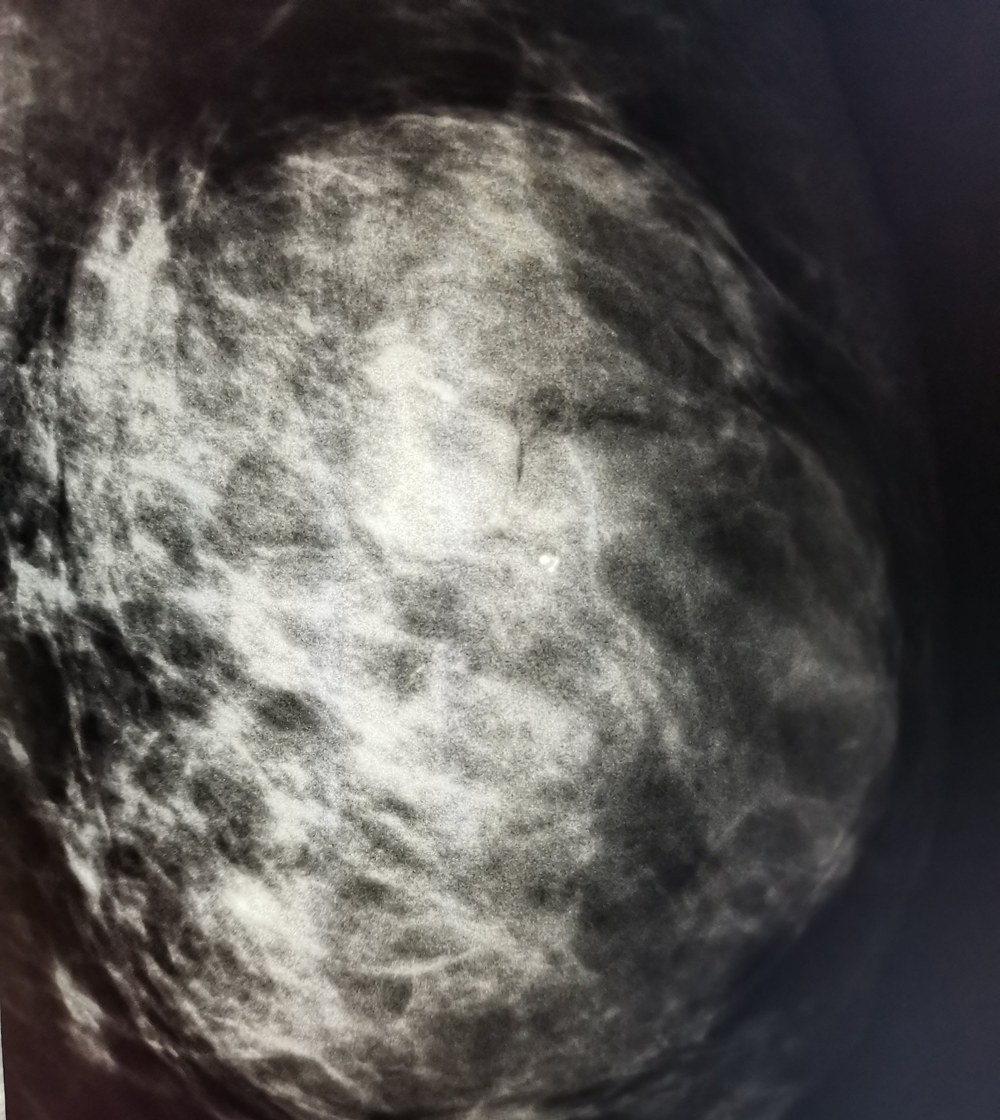 ROI 1EXAMPLE · MAMMOGRAPHY · AI MARKING ILLUSTRATIVEFOR REVIEW
Image: Cerevisae, High density mass in the left breast, CC BY-SA 4.0, via Wikimedia Commons. Cropped and resized; the marking is an illustrative overlay.

Mammography support
The AI highlights regions of interest on the mammogram for the radiologist to evaluate, as a second reader.
- Regions of interest
- Supports screening workflows
- Radiologist reads and decides
Example images carry no names or identifiers. AI markings are illustrative. Available algorithms depend on the use case and on regulatory status for the intended use.